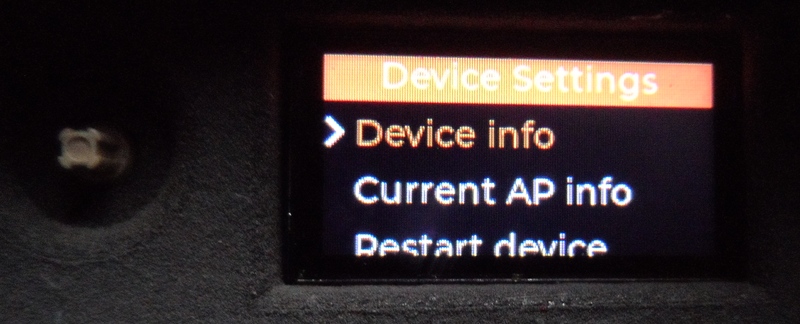
FreeDSM is accessible through its own web server. You can check the IP address in your router or, physically, access the configuration option of the device and select "AP information" (it will show the IP in use in the LCD screen). Simply use your favorite web browser and connect to that IP via HTTP.
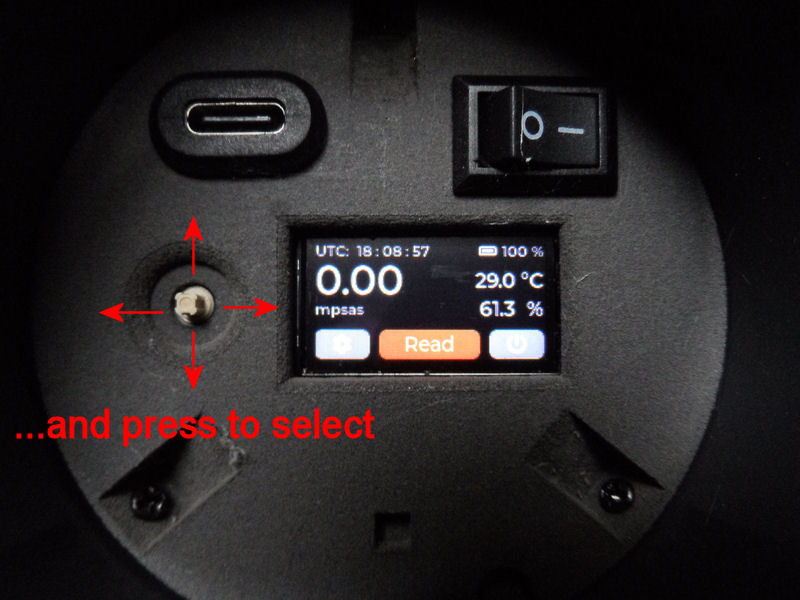
The device It has a power switch and a USB-C connector for charging. It also has a LCD screen and a Joystick to control the menus.
The FreeDSM provides the information in 5 different ways:
-
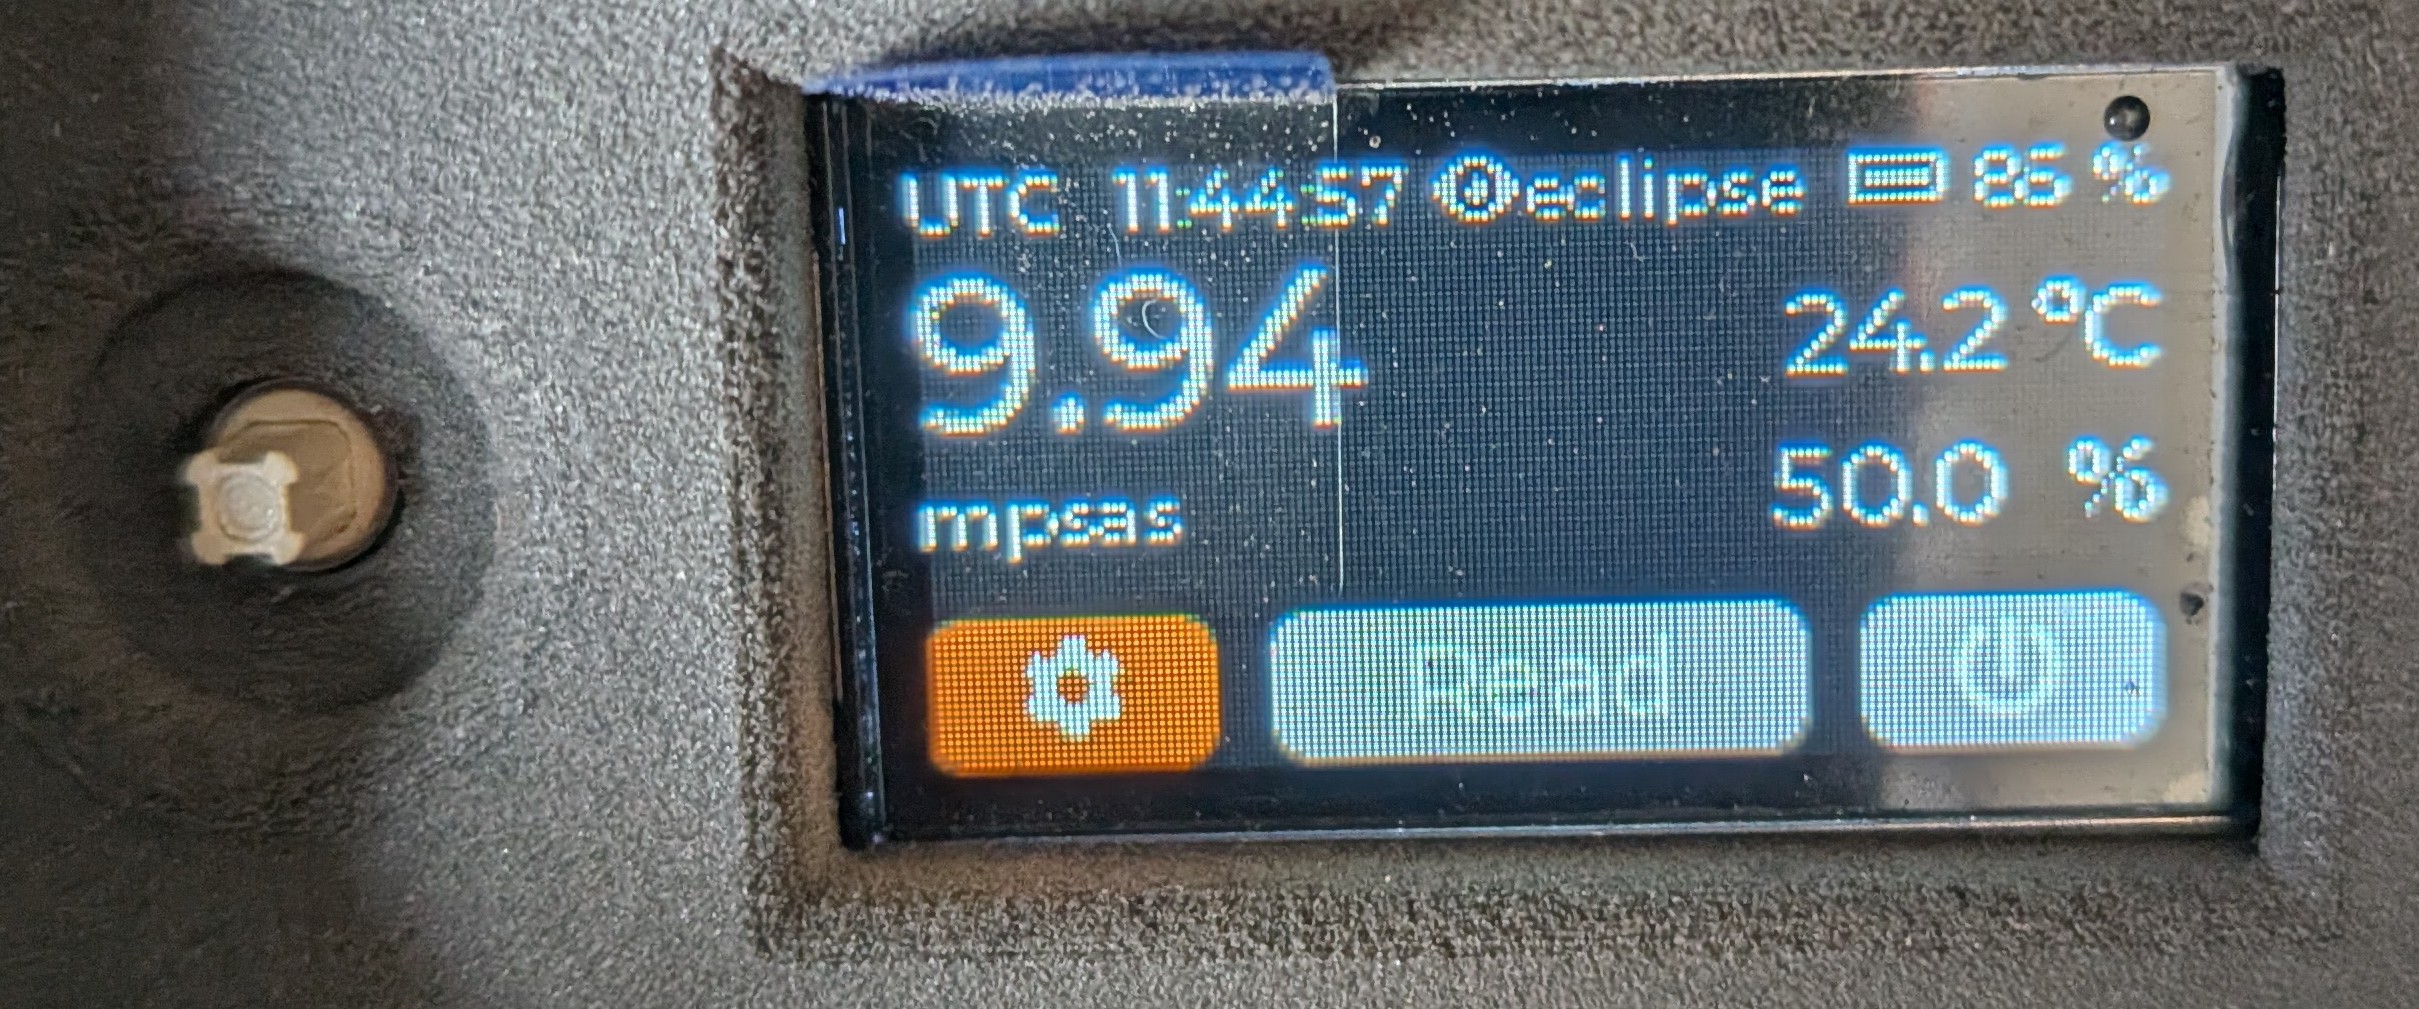
On the LCD display itself you can see the measurement information.
-
Through the web browser, on the main screen you will get complete information.
-
The firmware is based on Tasmota, so it integrates easily with any IoT installation. To send the data to, for example, your own HomeAssistant, you would have to configure the MQTT server with your web browser, with the option "Configuration" -> "Configure MQTT".
-
FreeDSM sends the information to the web platform of the project that developed the device (https://dsm.citic.udc.es). You can register to create an account, view the data, export it and compare it with our natural sky model (Gambons).
-
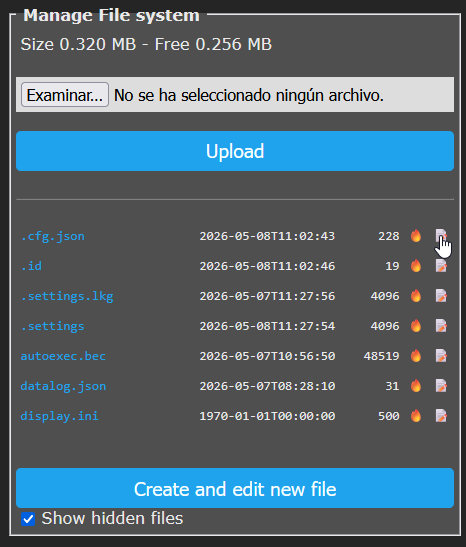
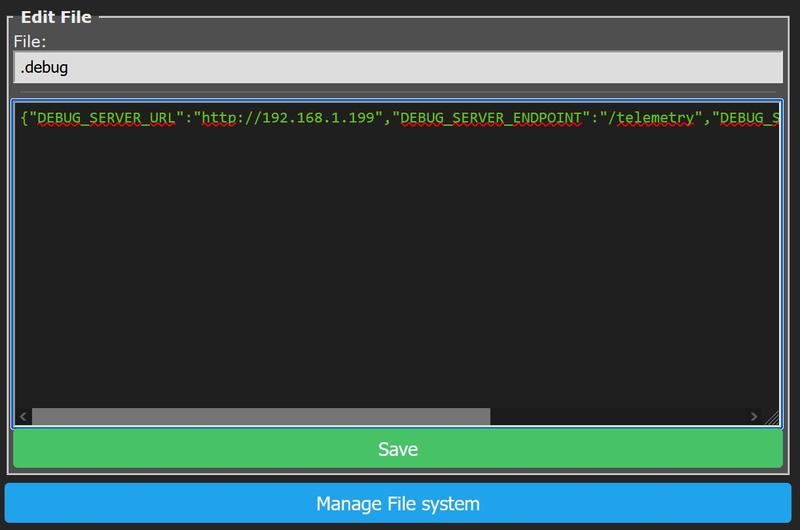
Additionally, there is a mode that we have called DEBUG to send the data in JSON format to any HTTP server you want to install. To enable it, using the web browser, go to "Consoles" -> "Manage File system", enable "Show hidden files" and you will see a ".cfg.json" file in the list. Click on the white icon and you will be able to edit it including the information of your HTTP server that will receive the data, the port and a field (1|0) to send or not the data when the light sensor is saturated (0 mpsas).
First boot
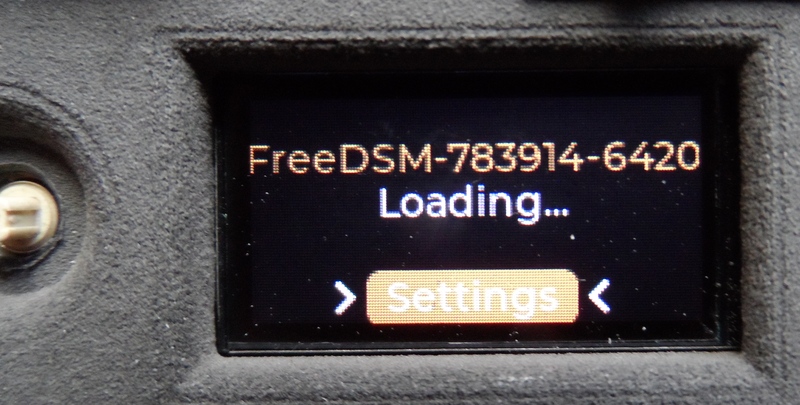
After the construction of the device and its firmware flashing, these screens should appear in the LCD screen.
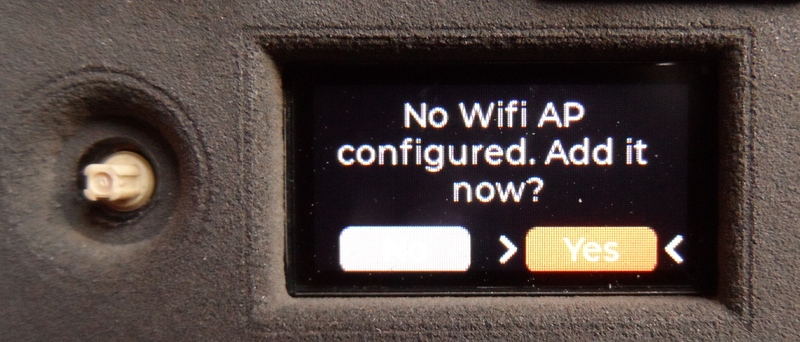
In the last one, you can see the message indicating that there is no wifi network configured. FreeDSM will create a wifi network during limited time (the wifi AP uses the same name as the device). The easiest way is to use our mobile phone to connect to that Wi-Fi network.
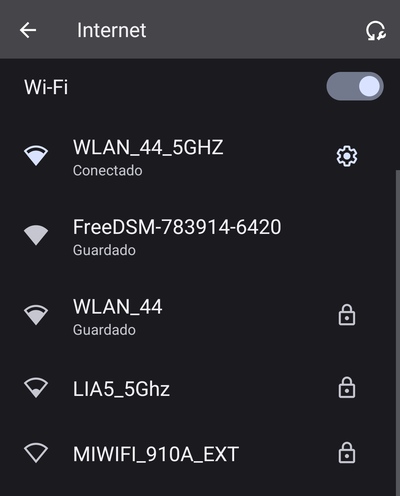
After the connection to this AP, we are usually automatically shown a web browser connected to the address: http://192.168.4.1. If not, we do it manually. On that page (which is provided by FreeDSM itself) we configure the wifi we want to use.
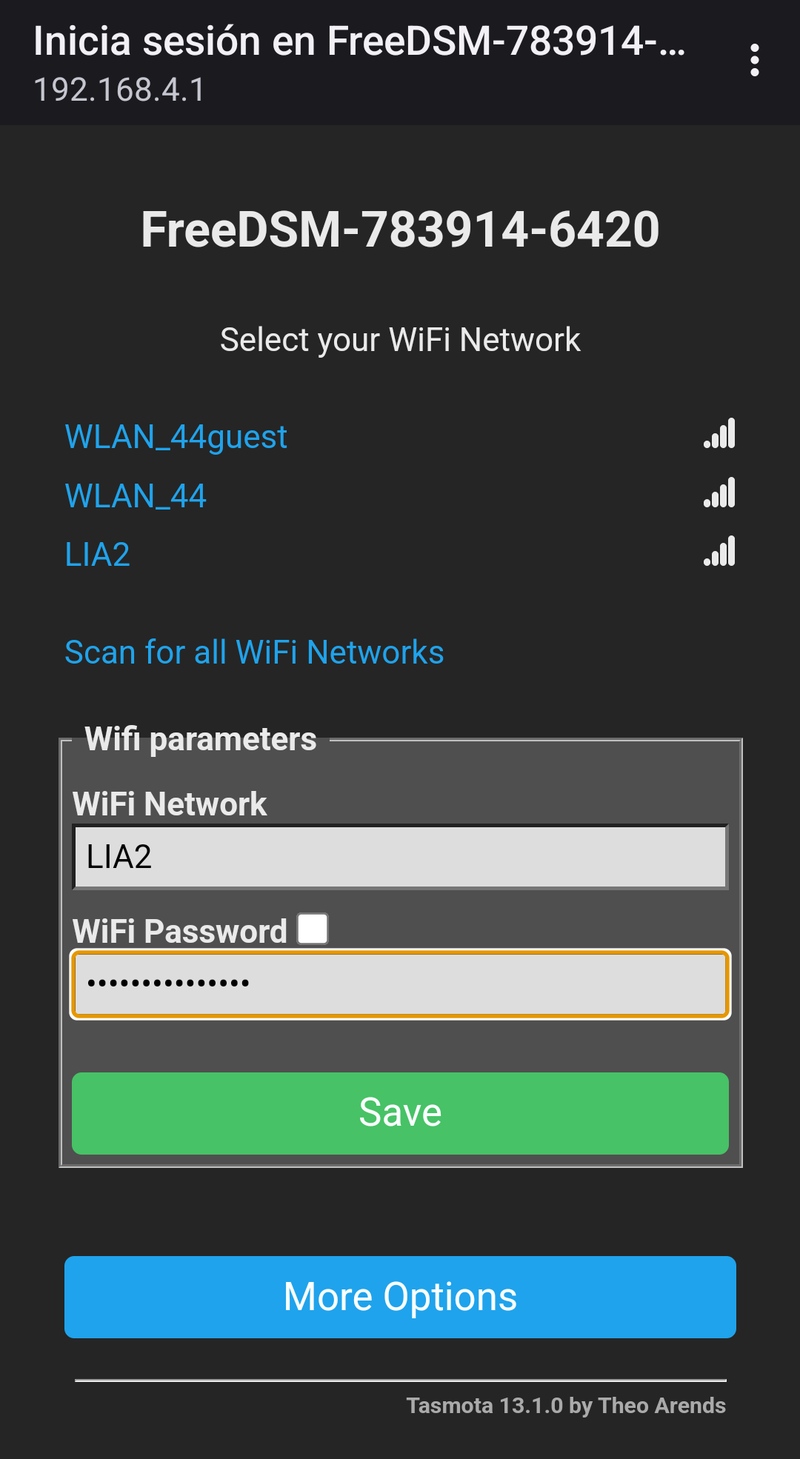
After choosing the Wi-Fi network and entering the password in the configuration interface, our FreeDSM will restart and, if everything has gone well, we will see that it already has a connection when it starts. In this case, the message indicates that the device is not registered in the platform (http://dsm.citic.udc.es), we recommend to do it.
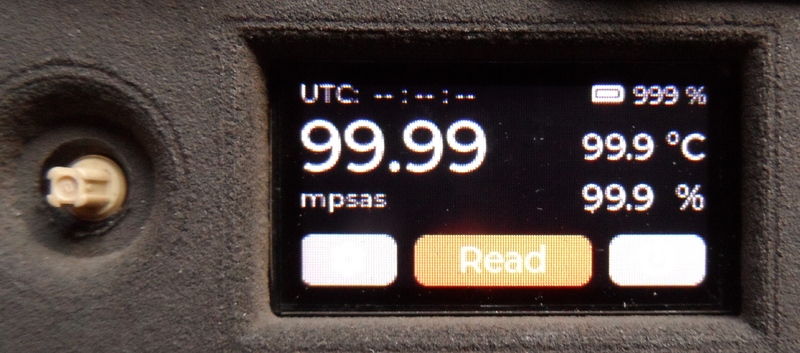
After starting up we will see the information on the display (these values are the ones from the start-up, when we do not yet have the time synchronization or measurements of light, temperature or humidity).
Settings and options
Remember that, for your FreeDSM to take part in the data collection campaign, you must create a profile and register the instrument on our website: http://dsm.citic.udc.es/
During the photometer’s normal operation, you can access the Settings menu, represented by a gear icon, by pressing the physical joystick next to the small LCD screen. Several options are available there, but the one we are interested in is “Data mode setup”, where you will find three additional settings that can be enabled or disabled:
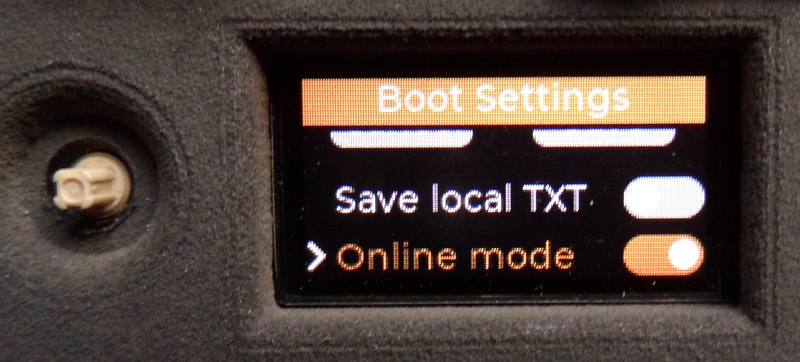
a) “Save online” is enabled by default and allows the FreeDSM to automatically send measurements to the platform.
b) If you enable “eclipse mode”, the sensor will configure so that it works correctly during the eclipse and in the minutes leading up to it on August 12, 2026. When this mode is enabled, an eye icon and the word “eclipse” will always appear at the top of the LCD screen. Remember to update the location of your FreeDSM at http://dsm.citic.udc.es/ so that it matches the place where you will be using it to monitor the eclipse.
c) Ideally, your FreeDSM should be connected to a Wi-Fi network with Internet access. Remember that you can always create a Wi-Fi hotspot using your mobile phone if no other option is available. If connecting it to the Internet is not possible, you can enable the “Save local” option so that the captured data is stored on the photometer itself in JSON format. This data can be downloaded through the web interface. Select “Console” or “Tools” → “Manage File System”, and then click on the “datalog.json” file to download it (very limited space, around 16h of data). If you used this option for the eclipse, please send this file by email to info@gaia4sustainability.eu, including the name of the photometer and its geolocation.
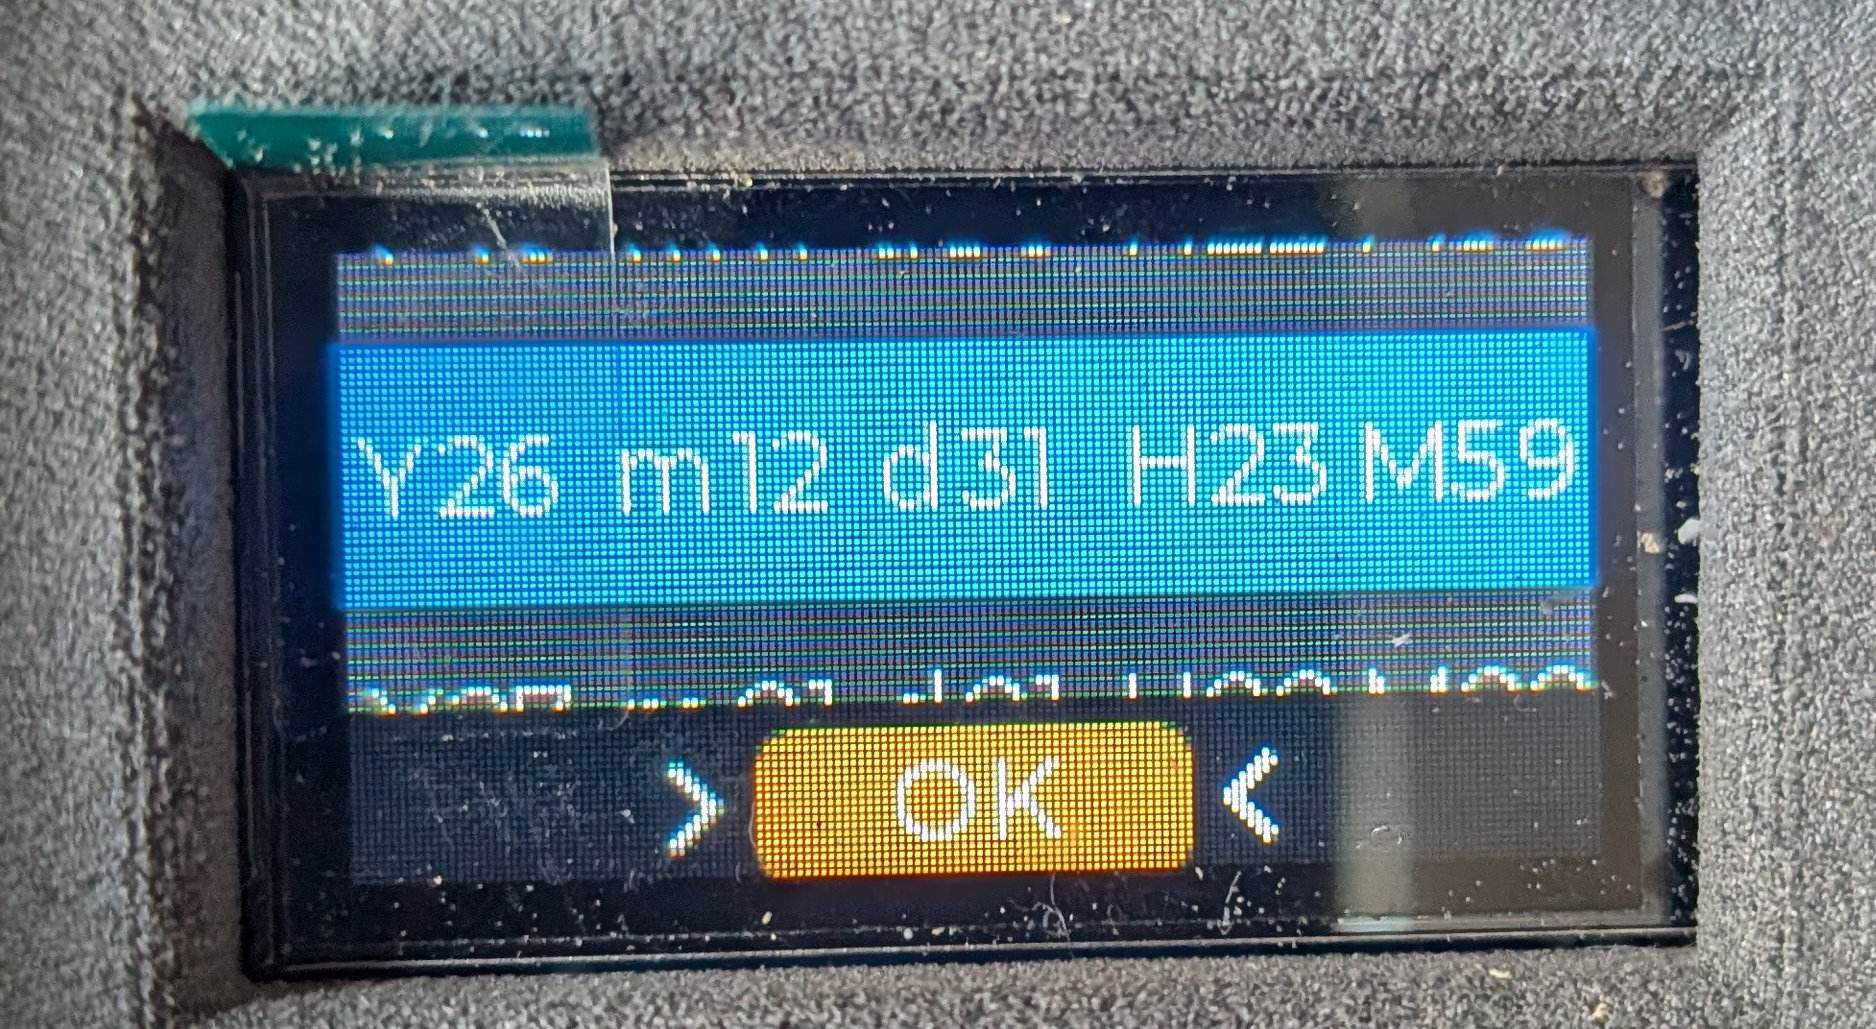
Remember that, without an Internet connection, the instrument will not be able to synchronize the date and time automatically. During the boot, it will therefore ask you to configure them manually (year/month/day/hour/minute).
How the sensors work
The photometer takes 6 light measurements at the end of each minute, sending the data. Additionally, it incorporates temperature and humidity information, as well as the raw measurements used for the calculation of mpsas and their calibrated value (calibrated mpsas are displayed on the LCD screen). The device has a built-in generic average adjustment, with which we have obtained an error of about 0.11 mpsas (on moonless nights) in relation to the measurements of a Tess-W. It is possible to perform individual calibrations with parallel FreeDSM / Tess-W measurements, although it is outside the scope of this document. In such cases, the error is reduced to 0.5 mpsas.
In addition to these automatic measurements, the "Read" button on the LCD screen can be selected using the joystick. This will trigger an instant measurement (provided an automatic one is not in progress) by turning off the display for about 6 seconds.