FreeDSM is accessible through its own web server. You can check the IP address in your router or, physically, access the configuration option of the device and select "AP information" (it will show the IP in use in the LCD screen). Simply use your favorite web browser and connect to that IP via HTTP.
FreeDSM provides the information in 5 different ways:
- On the LCD display itself we can see the measurement information.
- Through the web browser, on the main screen you will get complete information.
- The firmware is based on Tasmota, so it integrates easily with any IoT installation. To send the data to, for example, your own HomeAssistant, you would have to configure the MQTT server with your web browser, with the option "Configuration" -> "Configure MQTT"
- FreeDSM sends the information to the web platform of the project that developed it (https://dsm.citic.udc.es). You can register to create an account, view the data, export it and compare it with our natural sky model (Gambons).
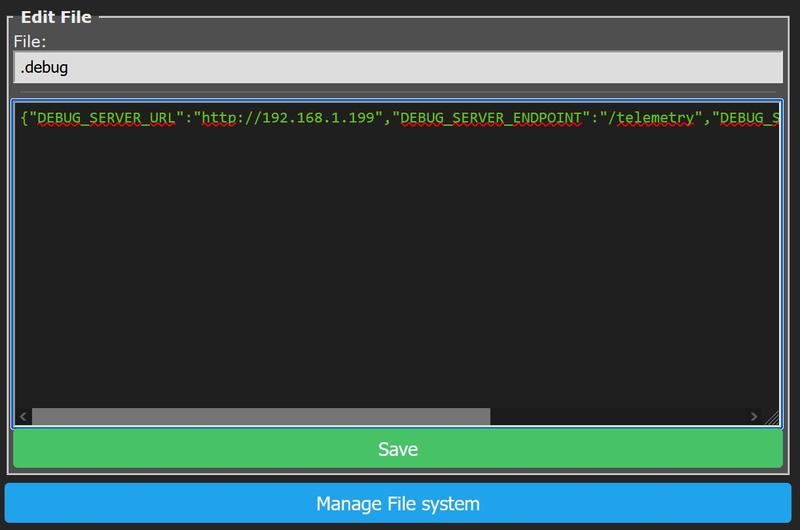
- Additionally, there is a mode that we have called DEBUG to send the data in JSON format to any HTTP server you want to install. To enable it, using the web browser, go to "Consoles" -> "Manage File system", enable "Show hidden files" and you will see a ".debug" file in the list. Click on the white icon and you will be able to edit it including the information of your HTTP server that will receive the data, the port and a field (1/0) to send or not the data when the light sensor is saturated (0 mpsas).
First boot
After the initial build and flash, when you start FreeDSM you should see this screen
To perform these processes, espfuse and esptool are needed. They are available as Python or compiled for different OS:

